How do you graph Charle's law?
1 Answer
Charles' Law examines the relationship between the volume of a gas and its temperature. So you would do an experiment in which you measure the volume of a gas at various temperatures. Let’s assume you get the following data.
T/°C, V/mL
0,,,,, 107.9
5,,,,, 109.7
10,,, 111.7
15,,, 113.6
20,, 115.5
25,, 117.5
30,, 119.4
35,,, 121.3
40,, 123.2
You would then plot a graph with temperature as the independent variable (along the horizontal or x axis) and volume as the dependent variable (along the vertical or y axis). You could do this by hand, but it is more convenient to use a computer or calculator to do the job for you.
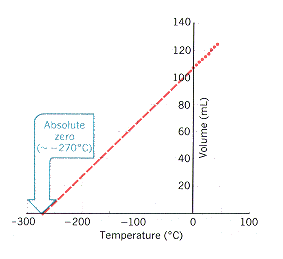
You should get a graph that looks something like the one below.

If you plot the data manually, you then extend the line backwards until it crosses the horizontal axis at about -270 °C. This gives you the temperature at which the gas theoretically has no volume (i.e, absolute zero).
If you use a computer or a calculator, you can tell it to calculate the equation for the line that best fits all the points (the regression line). My calculator tells me that the equation is
V = 0.3843T + 107.85
We want to find the value of T that gives V = 0.
0 = 0.3843T + 107.85
0.3843T = -107.85
T = -107.85/0.3843 = -280.6
Thus, the experimental value of absolute zero is -280.6 °C
It is no surprise that the values differ so much. We measured the volume over a 40 °C range, and we are extrapolating backwards by seven times that range. We should expect small uncertainties to multiply when extrapolating that far

