How do you graph ln(abs(x))?

1 Answer
Jan 24, 2016

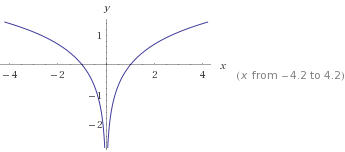
The typical graph of just ln(x) is

graph{ln(x) [-10, 10, -5, 5]}

Notice the domain restriction. In ln(x), x>0. That is, negative numbers are not in the domain of a logarithmic function.

However, in ln(abs(x)), negative numbers are made positive.

For example, both e^2 and -e^2, when plugged into ln(abs(x)), result in ln(e^2)=2.

In effect, adding the absolute value makes both the positive and negative realms available for the natural logarithm, in effect reflecting the graph over the y-axis, while retaining itself on the positive side:

![wolframalpha.com](https://useruploads.socratic.org/szDbMmdQX4tT0Gpiy0Hg_gif%26s%3D33%26w%3D345.%26h%3D152.%26cdf%3DRangeControl)