How do i graph limits?
1 Answer
Oct 21, 2014
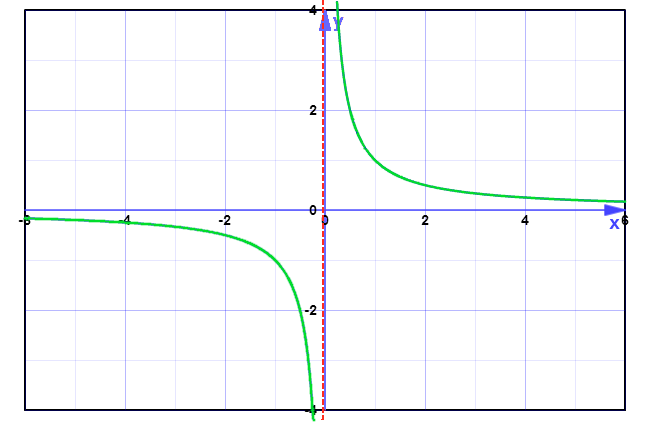
If your function approaches infinity or negative infinity as x approaches your limit you can represent the limit with a line or dashed line:

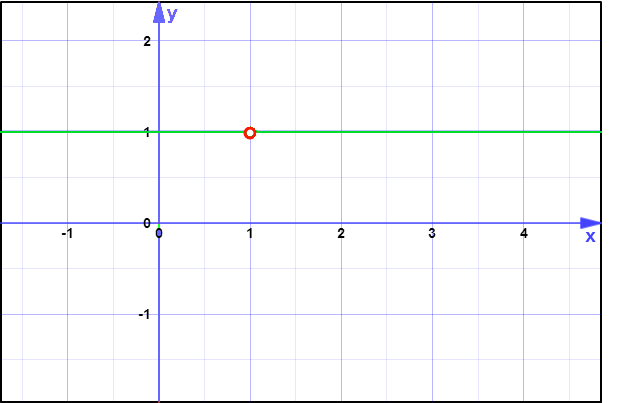
If your function does not trail off into infinity or negative infinite as x approaches your function you can represent the limit with an empty circle:


